


Amazon DevOps Guru is a fully managed service designed to help developers improve performance and availability of their applications. The service monitors and analyzes your application’s operational data events and application metrics in real-time and identifies behavior which deviates from normal operating patterns. Such anomalous behavior is then assessed by DevOps Guru and the service then reports those detected to be an operational issue or risk as reactive insights, along with recommendations to address the problem. In addition, DevOps Guru offers proactive insights aimed at avoiding your application’s likely operational issues in the future.
The potential issues are identified as anomalies or outliers and when an issue occurs, DevOps Guru generates insights with a summary of related anomalies and contextual information about the issue and provides recommendations on how to address the issue. It leverages machine learning models to correlate and group related anomalies so that the number of repeated or false positive warnings is minimized.
Setting up DevOps Guru involves two steps:
Differentiating the coverage by a particular CloudFormation stack or tag helps DevOps Guru to differentiate one app from another (an app is a collection of resources that are monitored together in DevOps Guru). Organizing your resources in separate apps allows you to better monitor them within a boundary by spotting correlated anomalies across interdependent entities.
For example, DevOps Guru’s monitoring of a single RDS will cost $3.024 (= 0.0042 * 24 * 30) per month.
The value of the service comprises these benefits:
For some services, such as AWS Lambda, it can even provide proactive insights of code refactoring hints. For more details, see this article.
Amazon DevOps Guru for RDS was introduced in December 2021.
The service supports Amazon Aurora engines with anomaly detection and detailed analysis and recommendations (with support for other RDS engines coming in future).
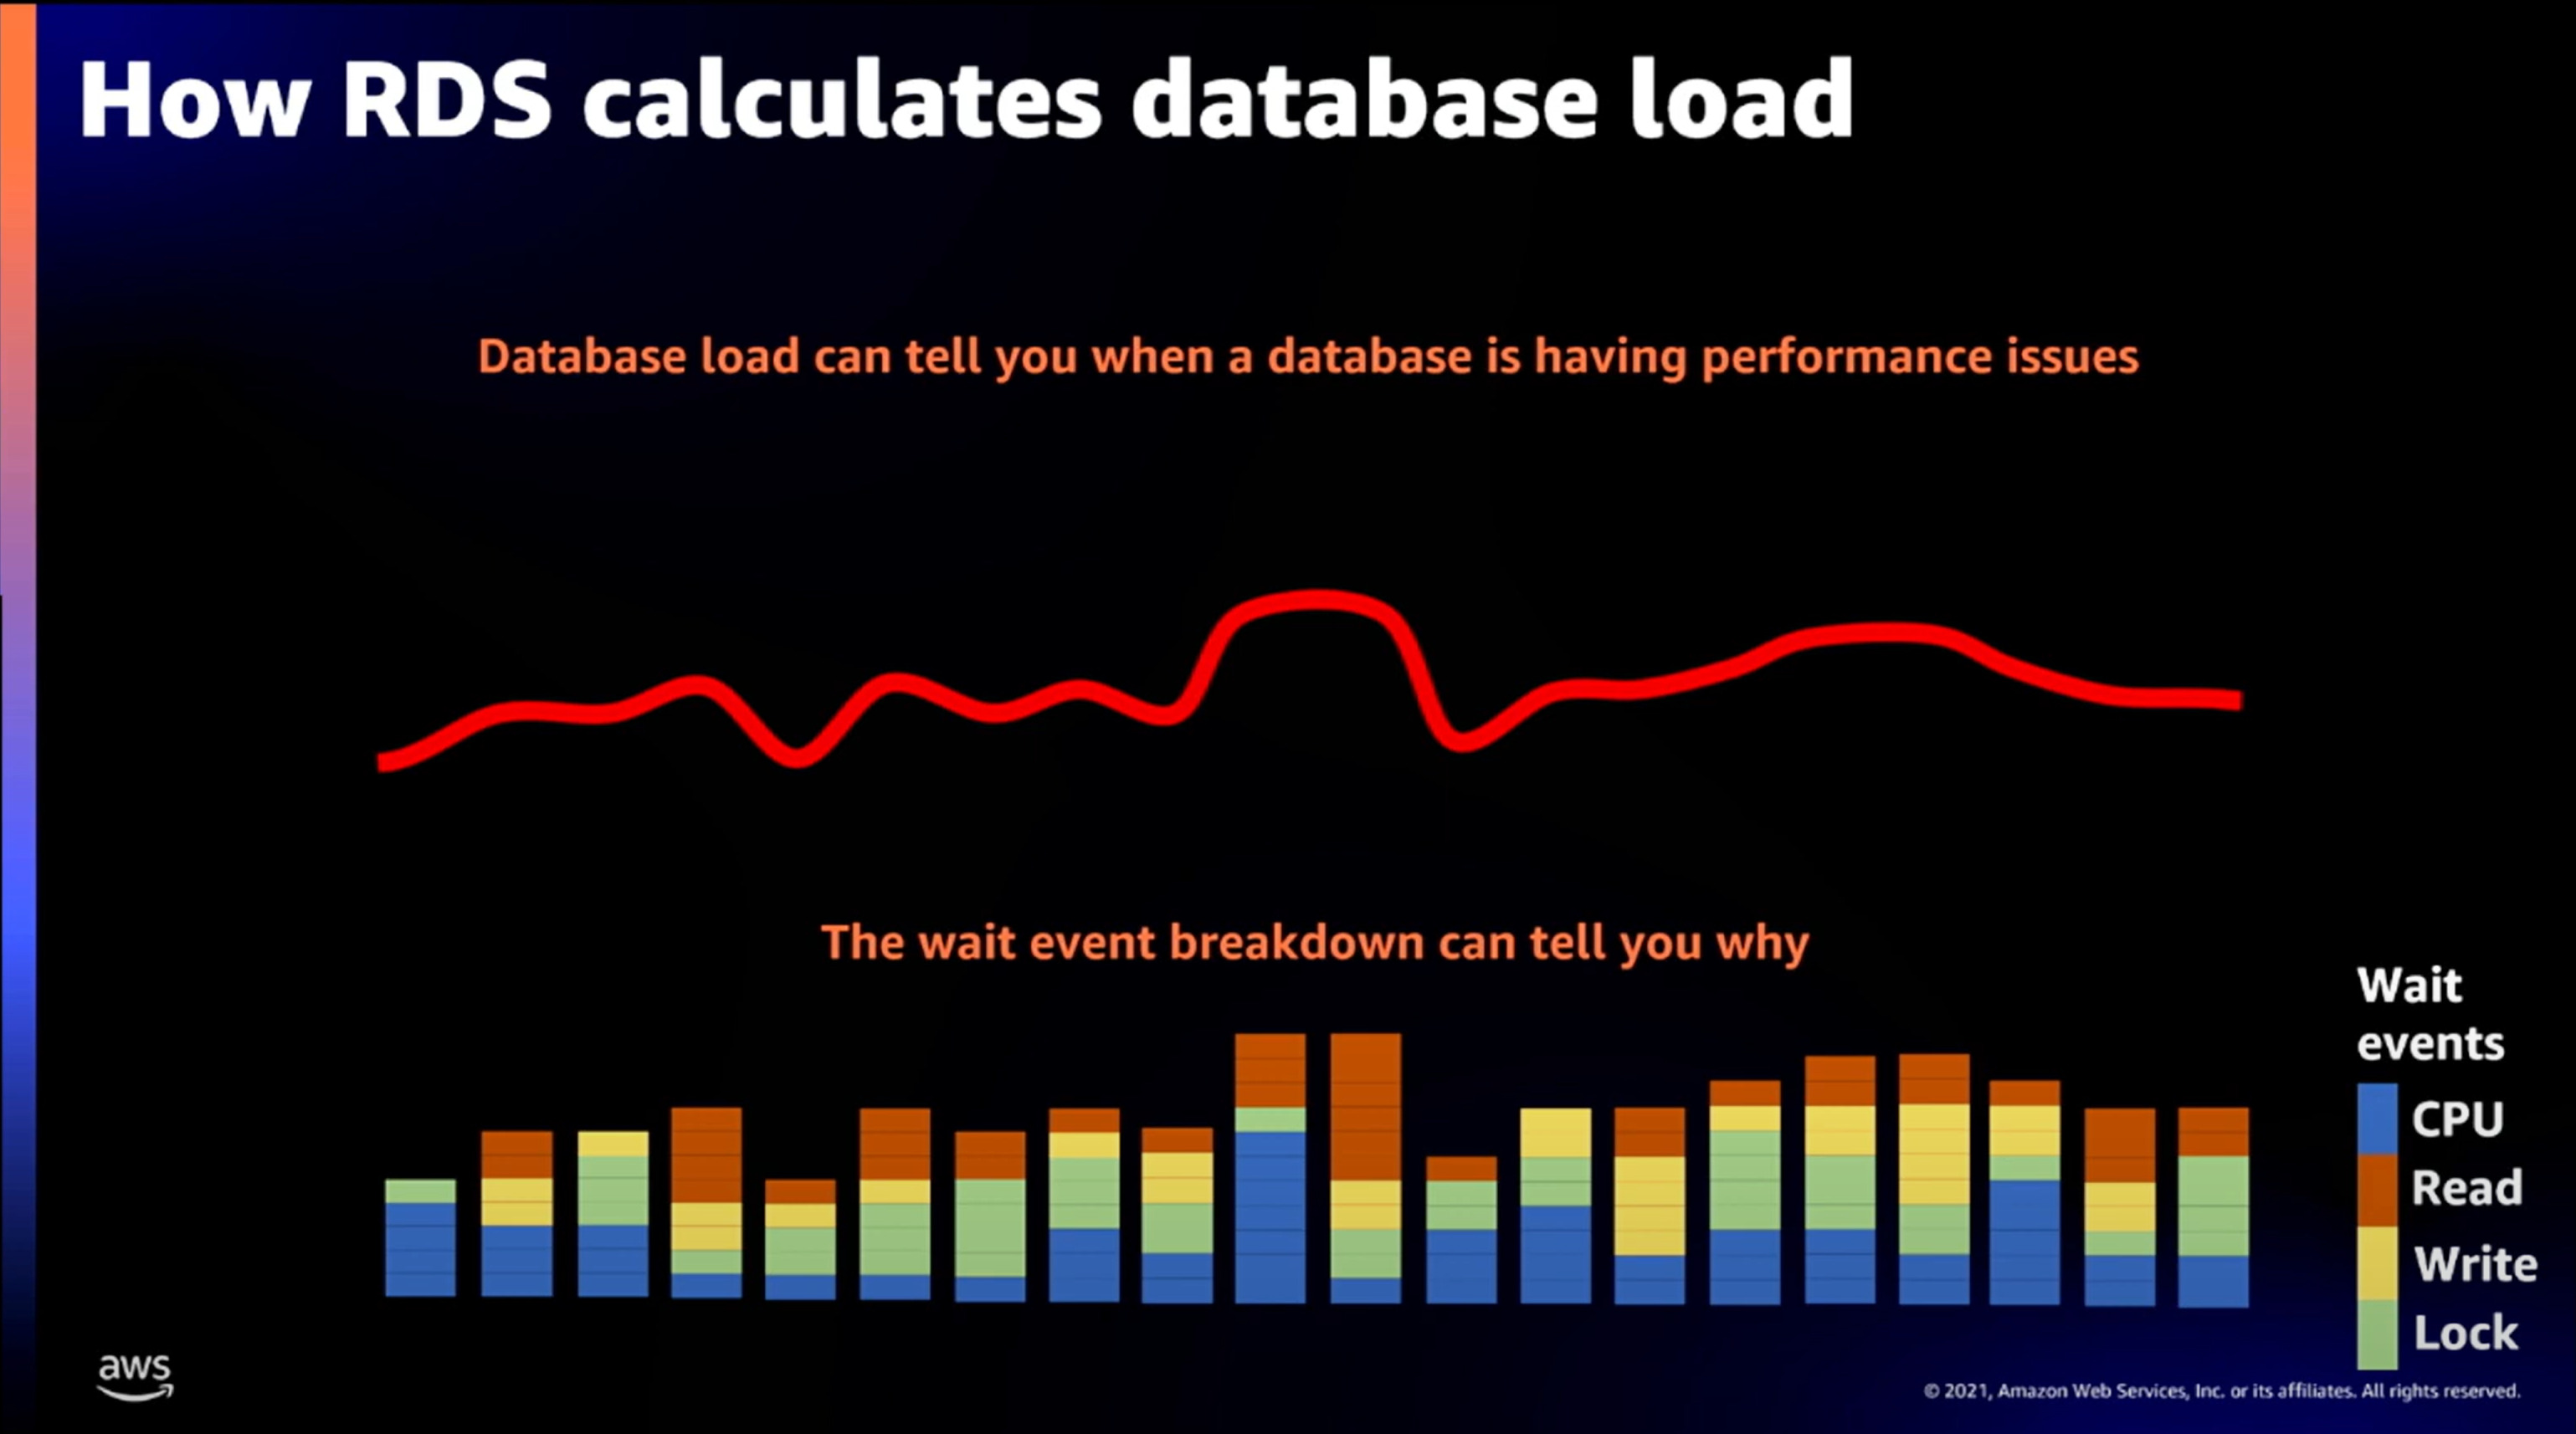
Amazon DevOps Guru for RDS builds upon the Amazon RDS Performance Insights’ concept of Database load. Database load is defined as the count of active sessions in a database, taken once a second. A session can be approximated by a connection and the word active indicates that the database is working on a request. Database load is a very accurate measure of how stressed a database is and of the database service quality.
Every database active session can be either running on the CPU or waiting. A database wait event occurs when the database is waiting for one of the database subsystems to execute a command. Each database technology has different names for the various wait events (see Aurora MySQL and Aurora PostgreSQL wait events). Each database engine has its own catalog of 100+ types of wait events.
For this example, let’s consider a database with only four wait events:
The usefulness of database load can be summarized as follows:
(ref: https://www.youtube.com/watch?v=iwQNQHwoXfk)
DevOps Guru for RDS then monitors the Database Load metric for anomalies such that
When DevOps Guru for RDS finds an anomaly, it analyzes these factors:
DevOps Guru for RDS uses a set of rule-based algorithms for analysis, generates simple explanations for the dominating wait events, provides recommendations for the next steps and publishes the findings as an SNS event along with relevant metadata. The developers then need to go through the identified SQL statements and associated wait events one by one and determine the exact cause of the anomaly using the troubleshooting documents that DevOps Guru for RDS links as reference.
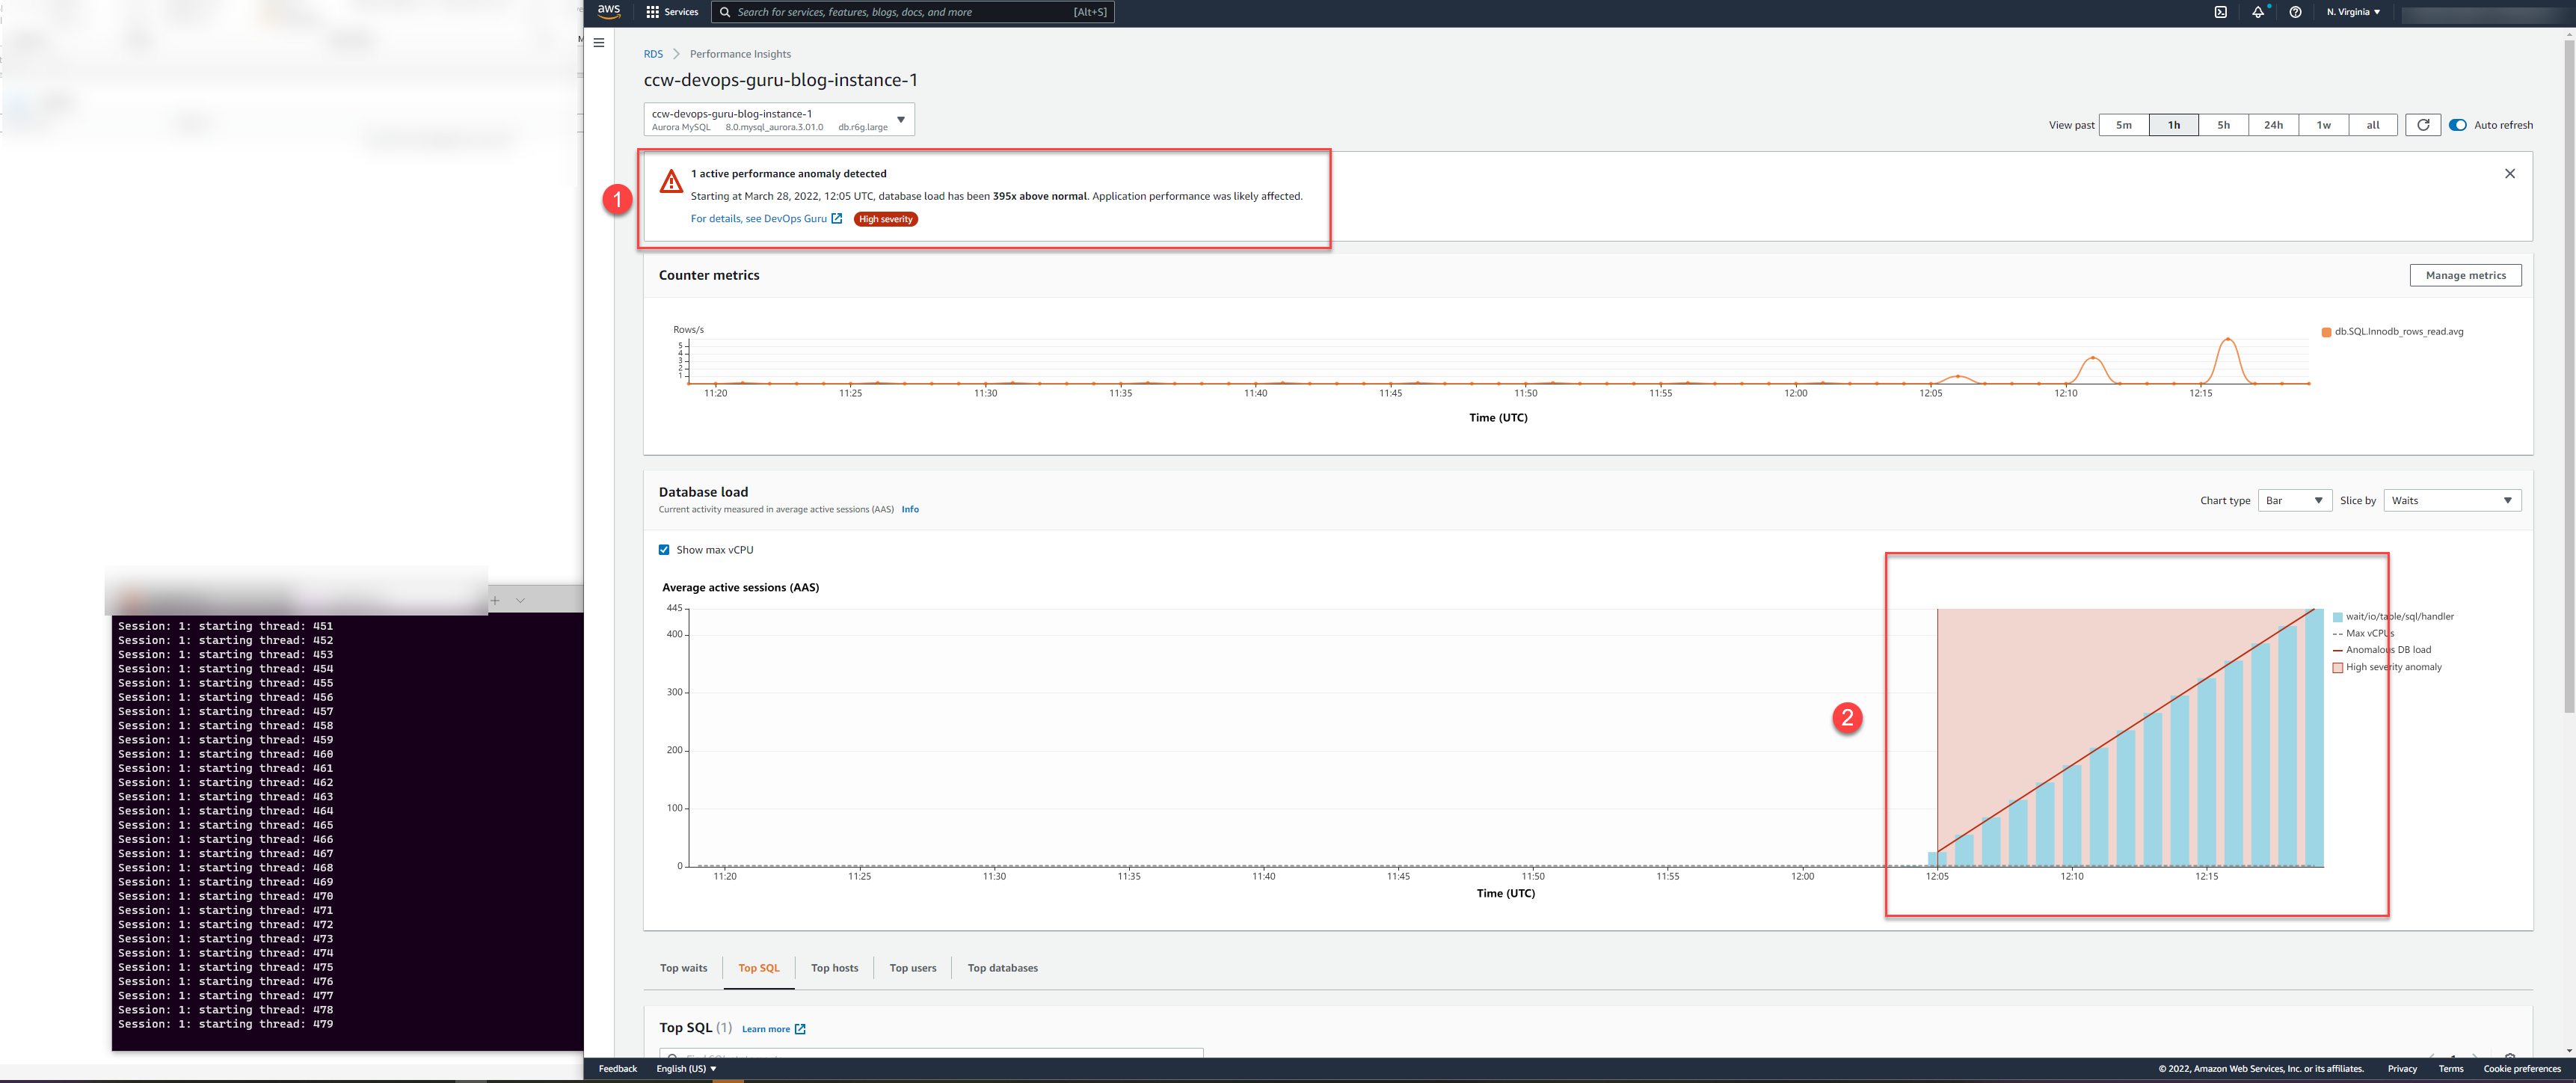
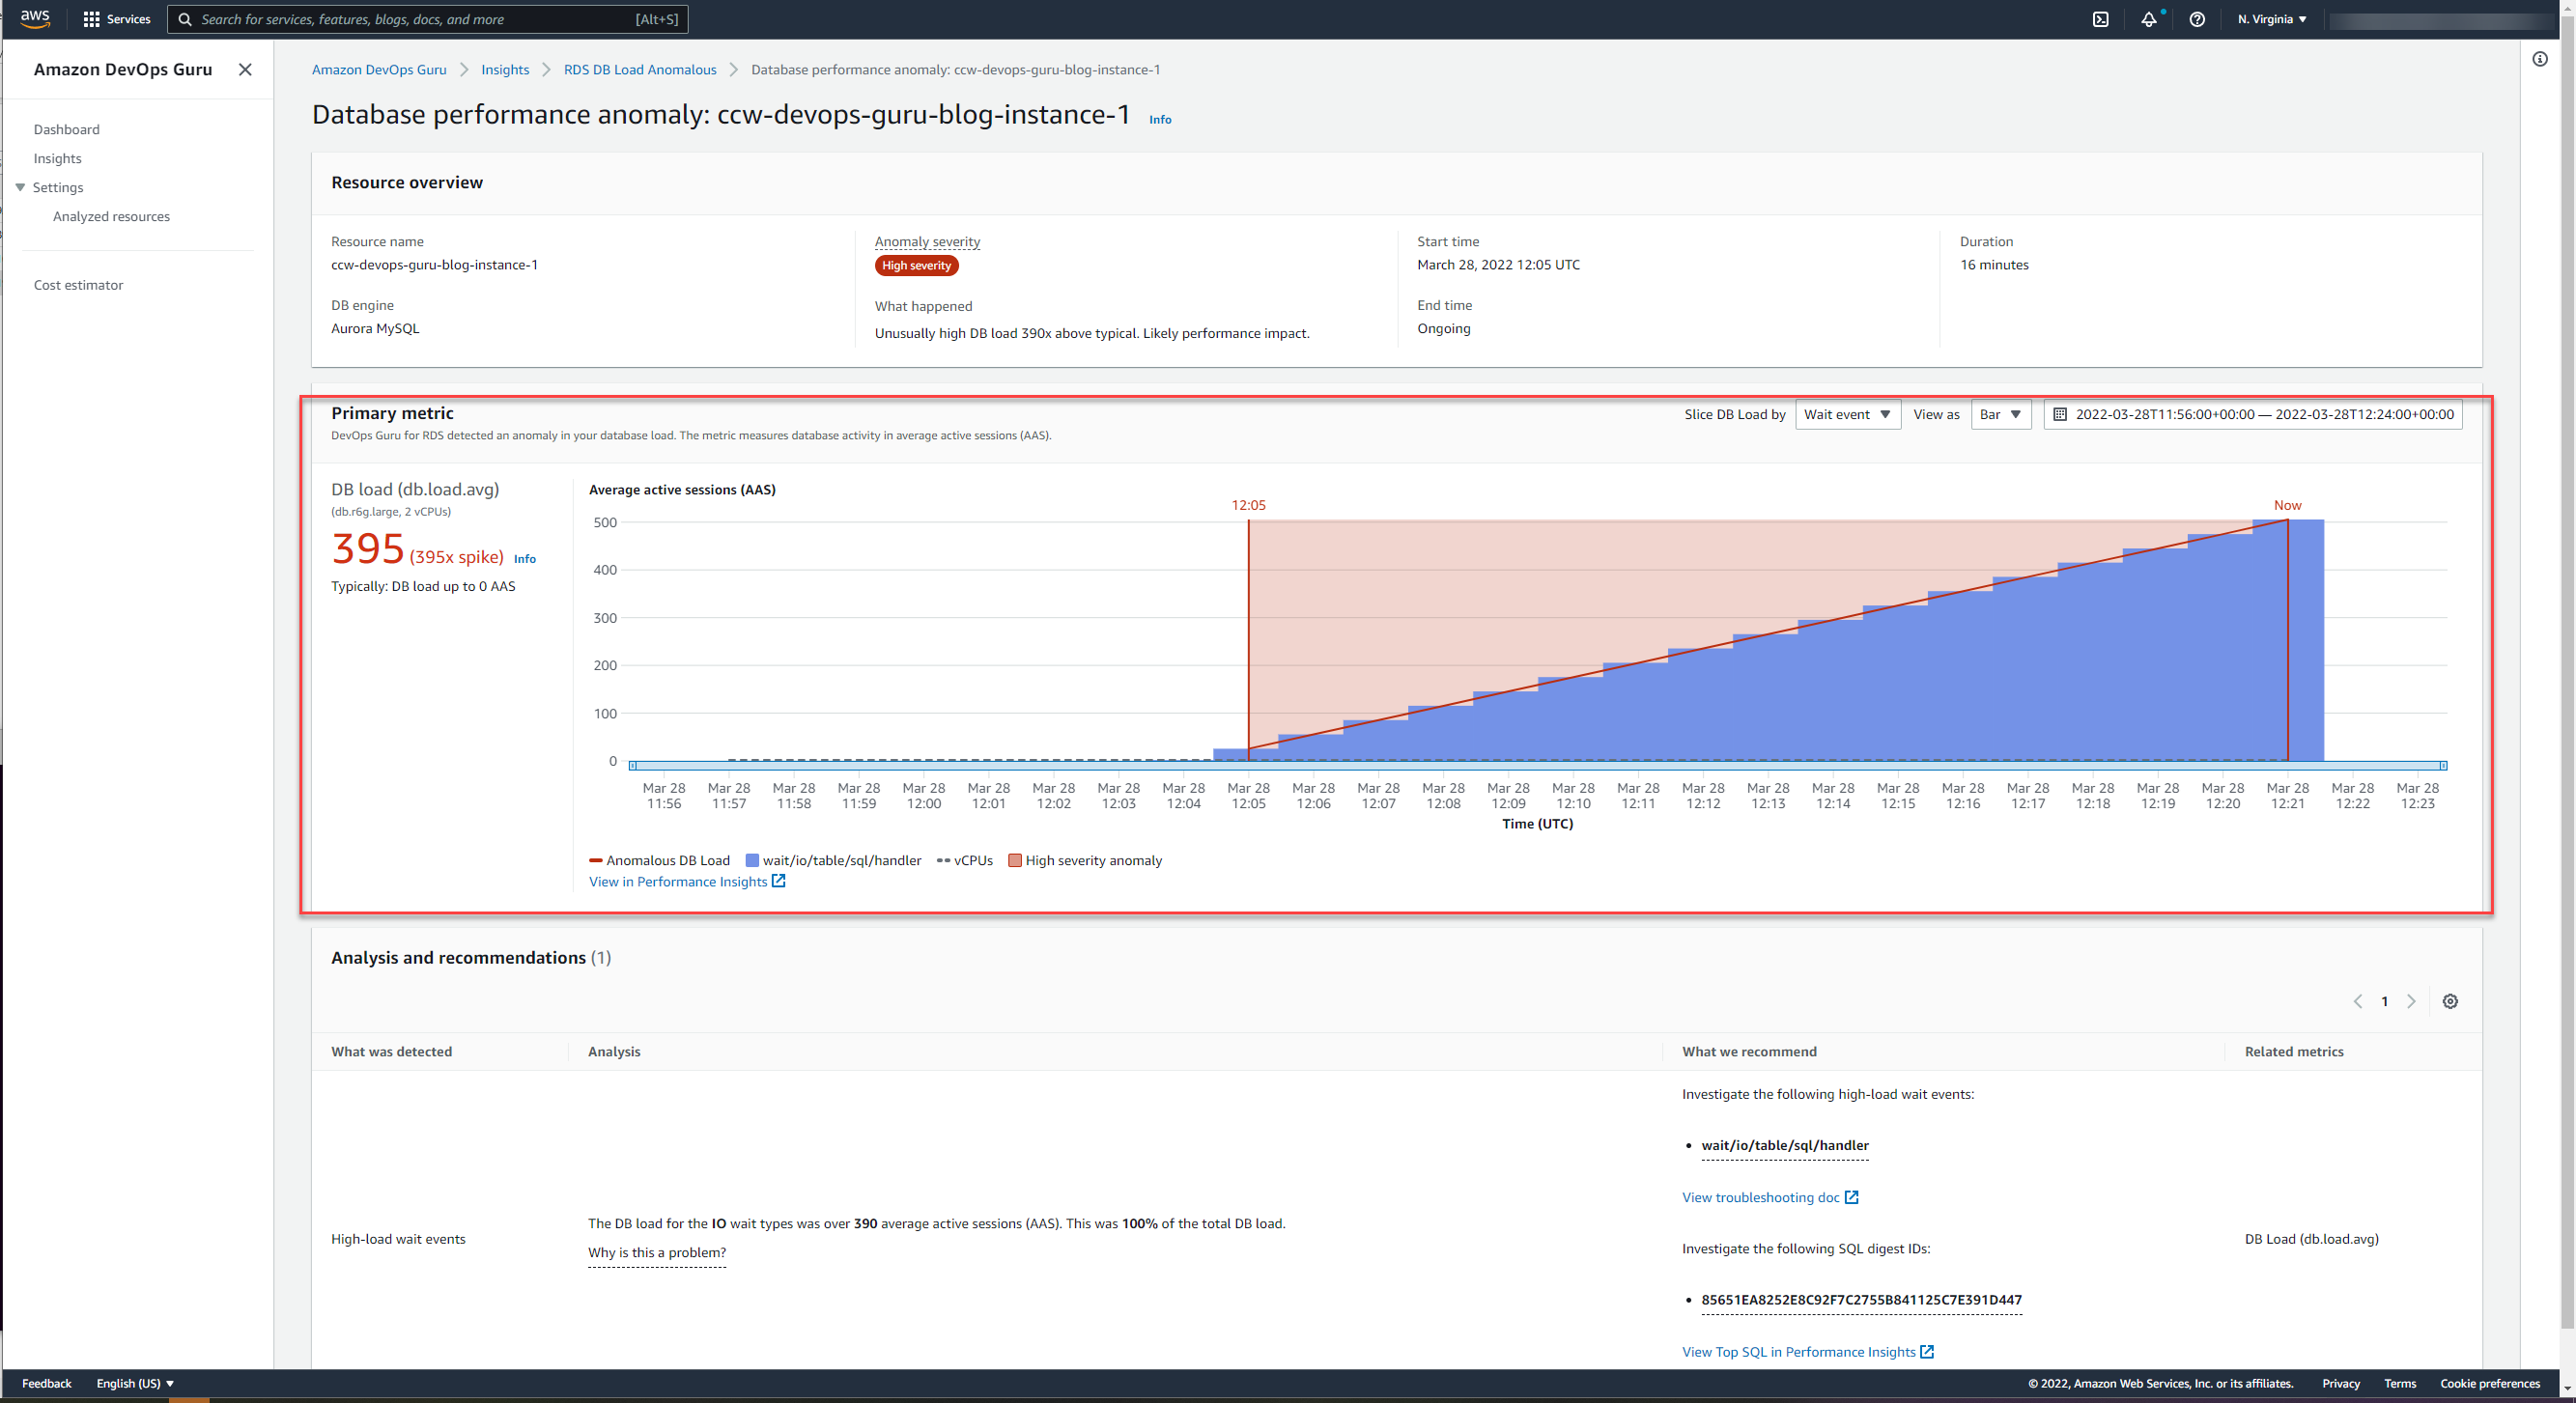
Examples of anomalies identified by DevOps Guru for RDS:
The main performance anomaly that DevOps Guru for RDS identifies is based on DB load metric. However, in addition to the “main anomaly”, DevOps Guru for RDS also reports “contextual anomalies” which include high CPU, Memory, Number of Database Connections and similar statistics. These contextual anomalies provide additional relevant details that can help you troubleshoot the issue faster.
The key decision DevOps Guru for RDS makes is the determination of the baseline for all anomalies.
Prerequisites:
Once these prerequisites are met, it takes a few hours to establish the baseline and start generating findings. The baseline is based on up to last 14 days of historical data.
Notice: the mentioned number of days are subject to change.
DevOps Guru for RDS relies on RDS Performance Insights to collect performance telemetry for a database e.g. database load and corresponding wait events.
For Aurora MySQL with enabled Performance Schema, it can show timed wait events. With disabled Performance Schema, it shows thread states instead of wait events which are not so precise.
For Aurora PostgreSQL, there is no Performance Schema and all relevant metrics are provided natively from the database server.
If analysis of these reported anomalies shows that they are not anomalies, but part of standard operations, then the database instance has to be upgraded.
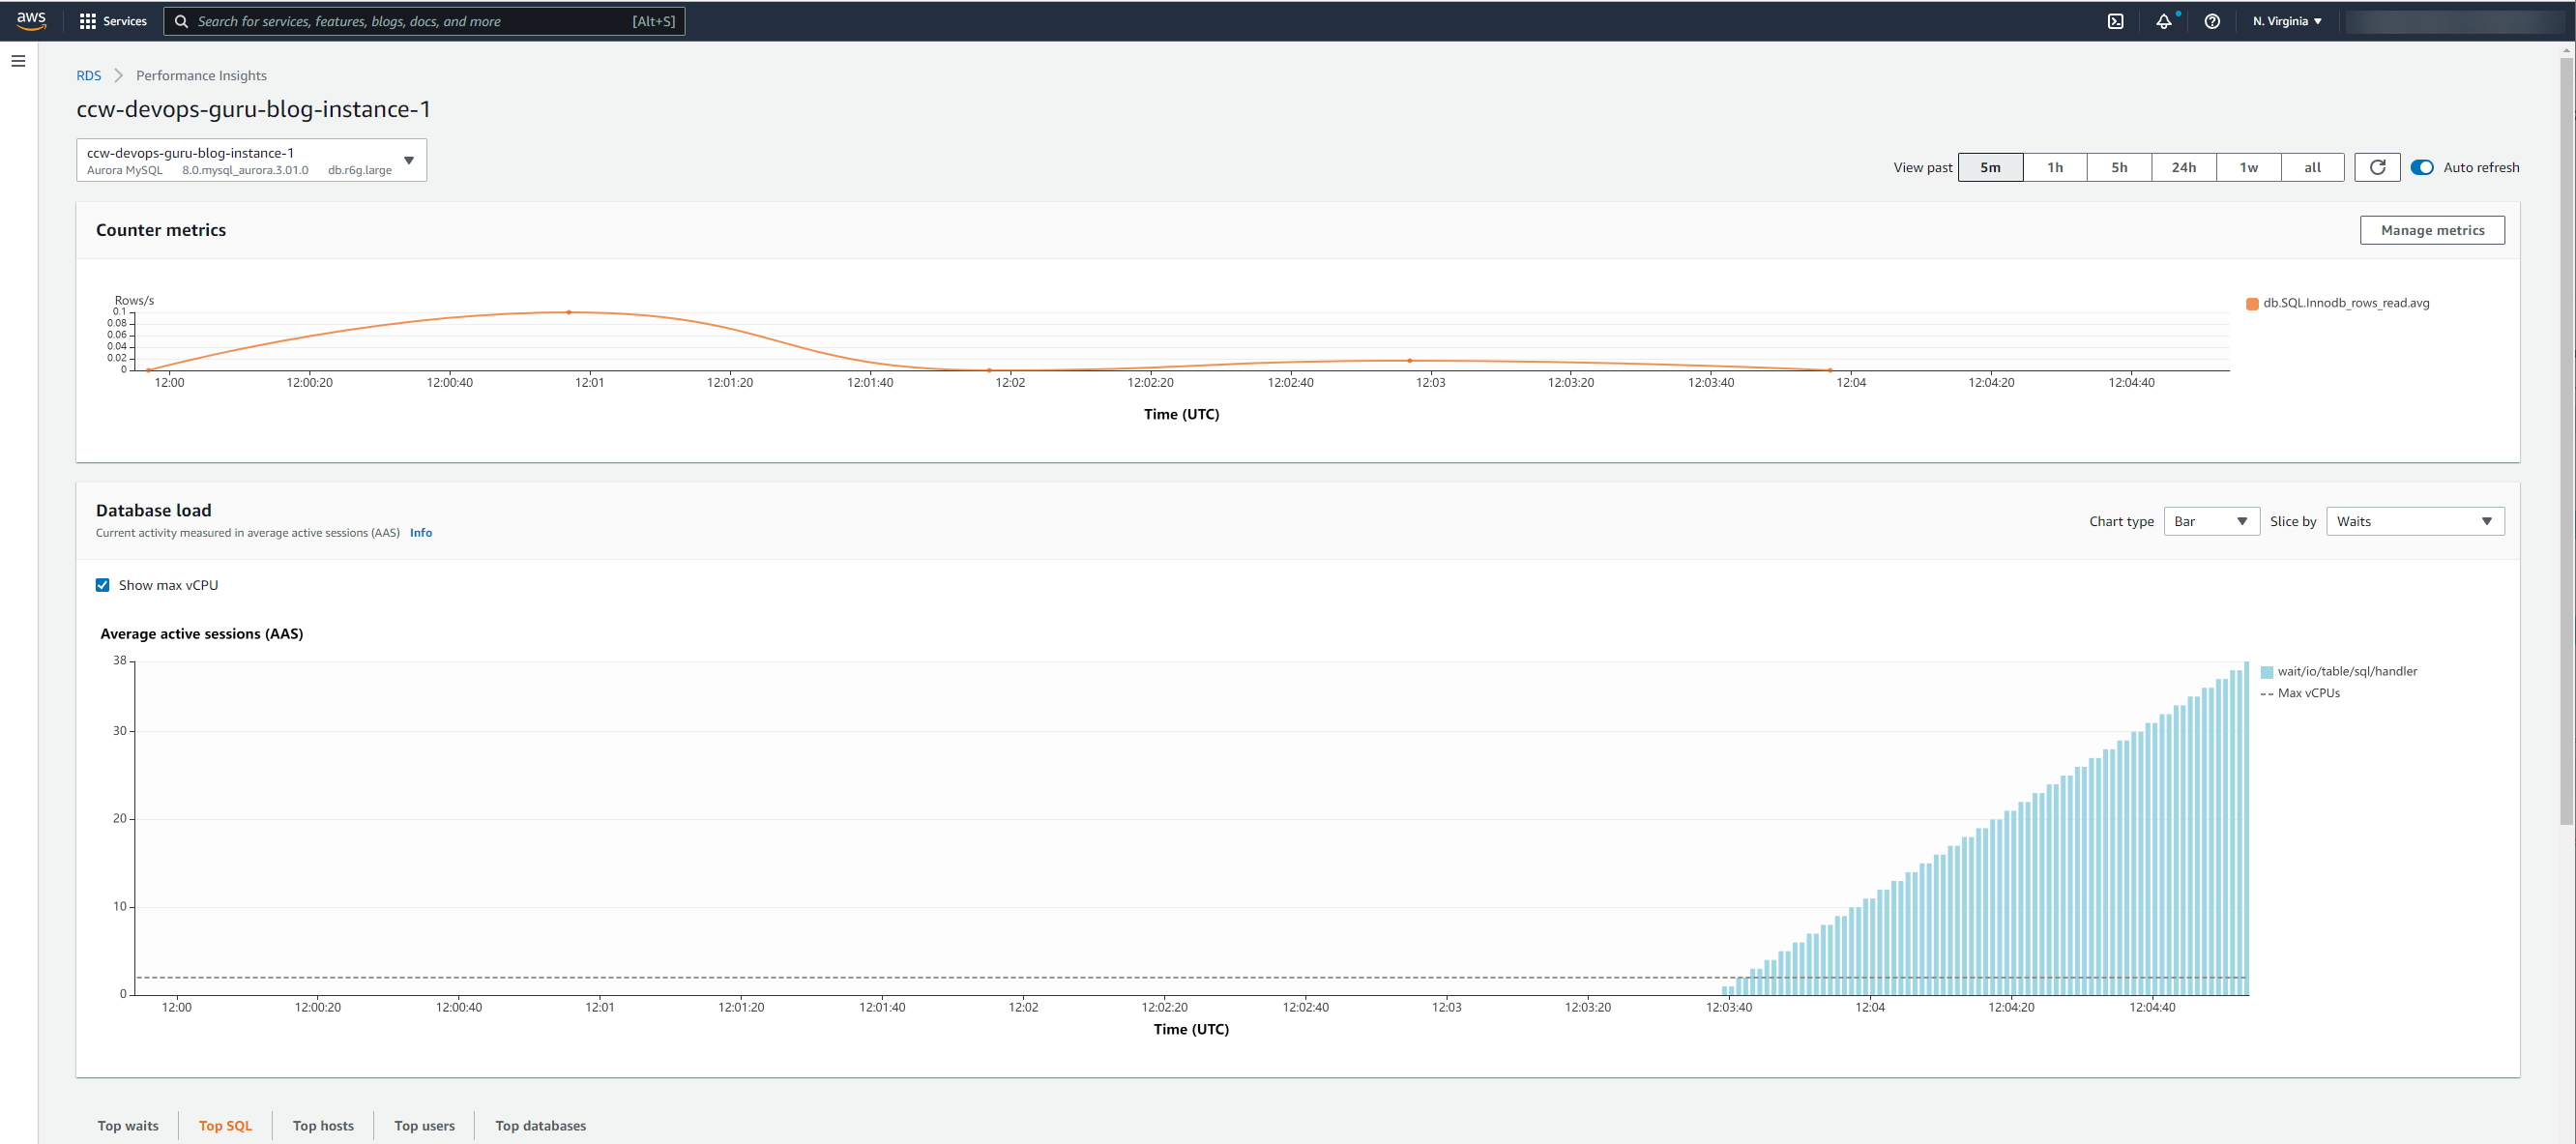
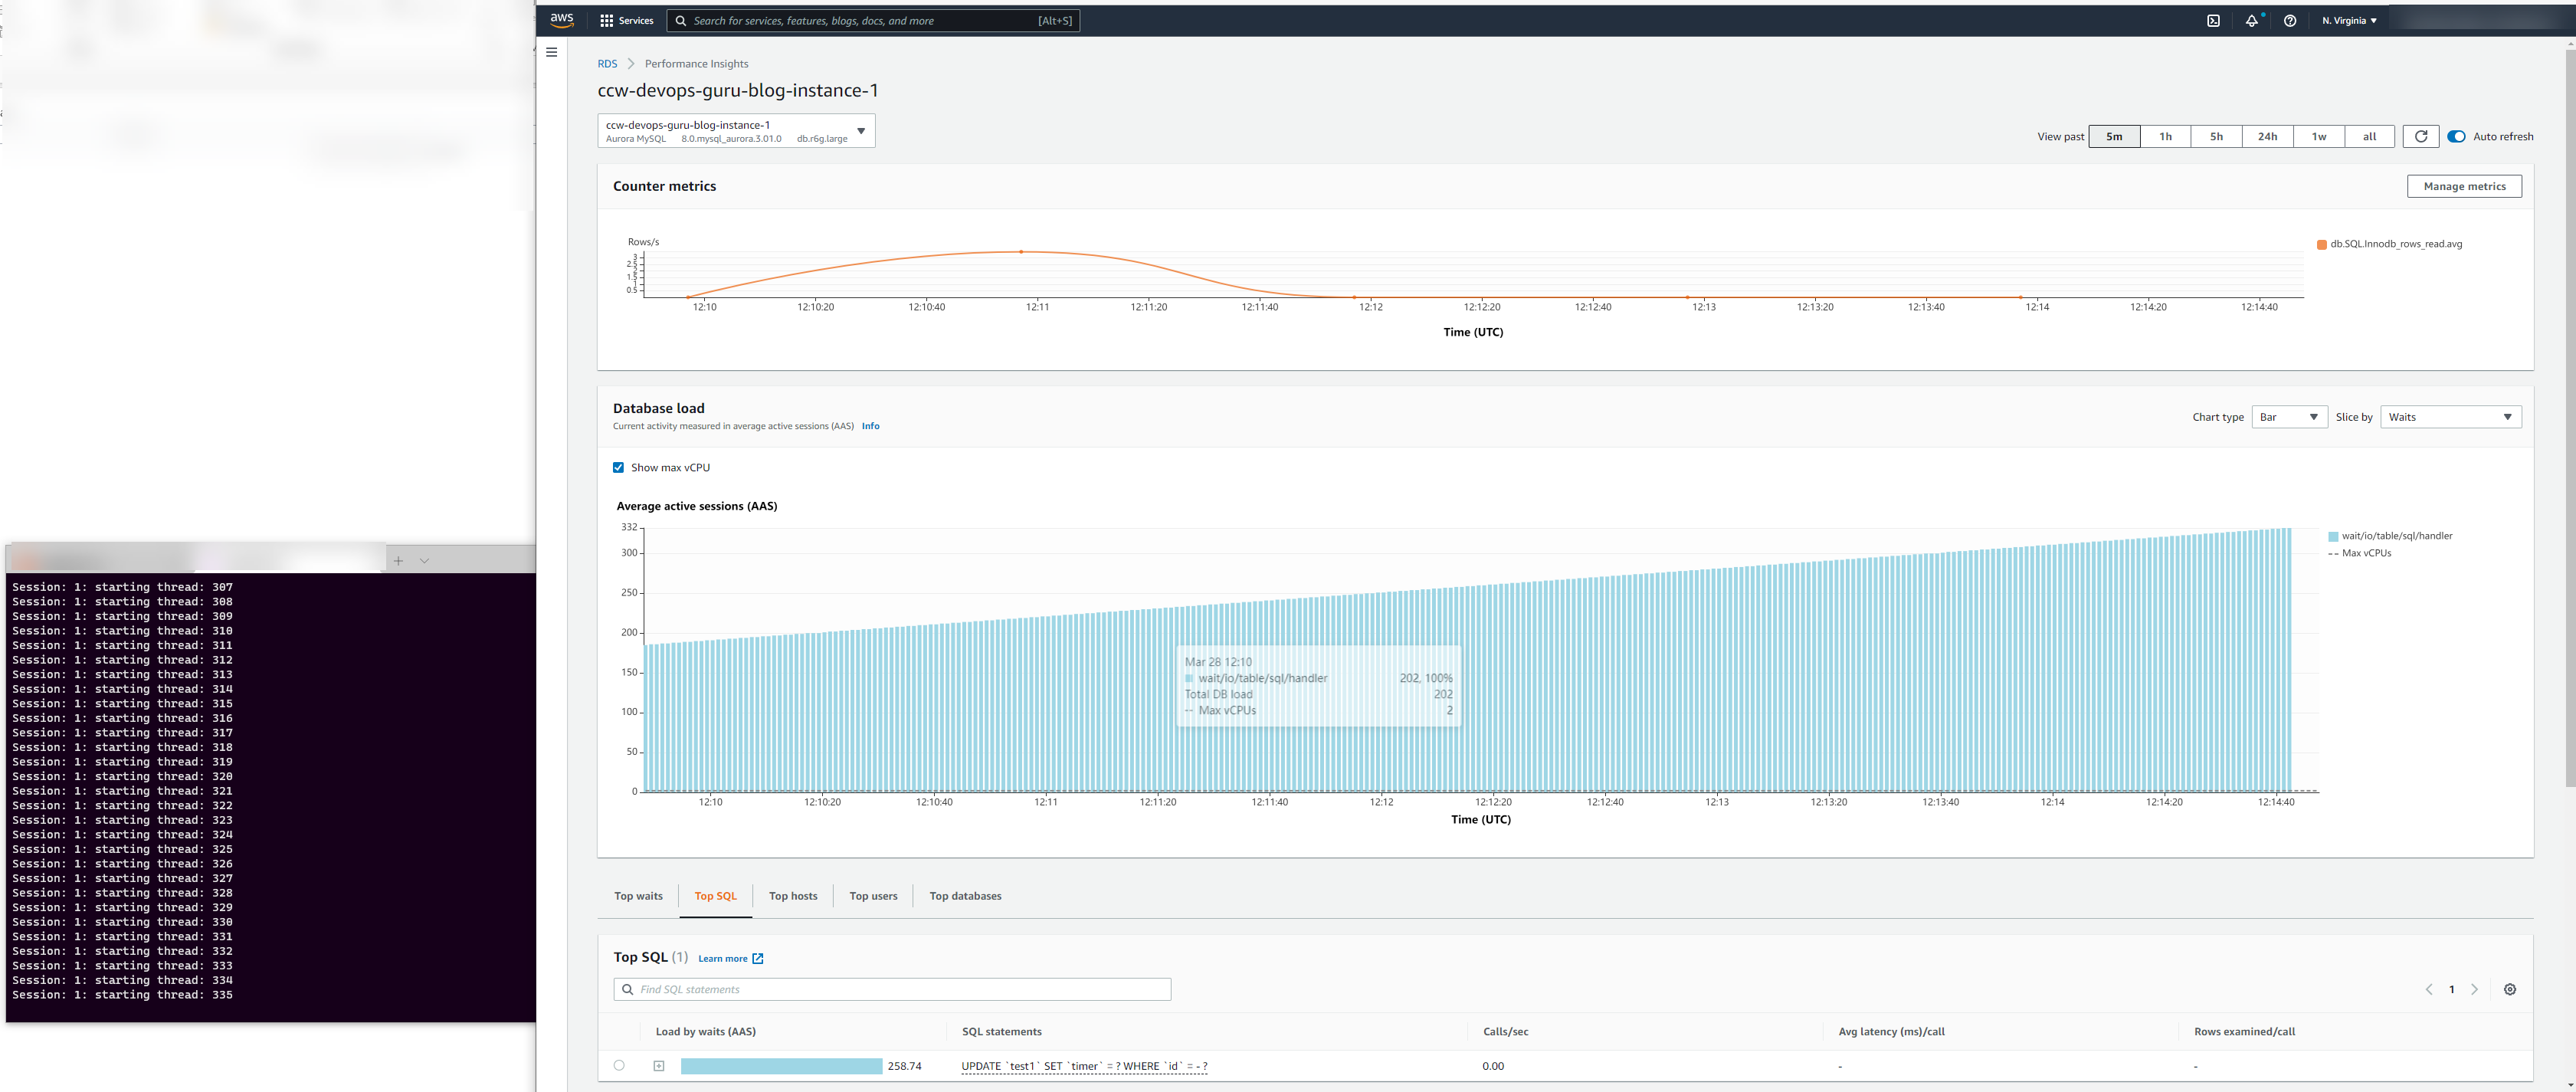
Let’s simulate a DevOps Guru for RDS anomaly with a real-world example of locking of a record.
Setup:
| create table test1(id int, filler char(255), timer timestamp); |
| create unique index test1_pk on test1(id); |
| insert into test1 values(-1, ‘locker’, current_timestamp); |
| start transaction;
update test1 set timer=current_timestamp() where id=-1; |
| #! /bin/env python3
import mysql.connector import string import random import os import sys import threading import multiprocessing from datetime import datetime from time import time, sleep # Example: ams_locking_scenario.py 1 1200 2 # Worker: 1 # Run for 1200 seconds (20 minutes) # Add a new competing session every 2 seconds session, max_seconds, delay_seconds = int(sys.argv[1]), int(sys.argv[2]), int(sys.argv[3]) def create_lock(timer): conn = mysql.connector.connect( user=’admin’, password=’XXX’, host=’ZZZ.us-east-1.rds.amazonaws.com’, database=’sysbench’, use_pure=False )
cursor = conn.cursor() sql = “update test1 set timer=%(timer)s where id=-1” cursor.execute(“set innodb_lock_wait_timeout=%(timeout)s”, {“timeout”: max_seconds+50}) cursor.execute(sql, {“timer”: datetime.now()}) cursor.close() conn.close()
print(f”BEGIN: {session}”) i, threads, start_time = 0, [], time() while True: if time() – start_time > max_seconds: break try: print(f”Session: {session}: starting thread: {i}”) x = threading.Thread(target=create_lock, args=(datetime.now(),)) threads.append(x) x.start() sleep(delay_seconds) i += 1 except Exception as e: print(f”Session: {session} failed at: {i}: {e}”) sleep(1) print(f”END: {session}”) [_.join() for _ in threads] |
With command
| python3 ams_locking_scenario.py 1 1200 2 |
Amazon DevOps Guru for RDS is a critical tool for identifying and rectifying existing and potential operational problems on AWS RDS databases.
Oquant’s mBase strategy processes daily terabytes of historical and real-time market data in search of trade signals, allowing it to leverage the majority of AWS managed services in synergistic architectures at a larger scale than allowed by any other public cloud.
While we extensively utilize various types of time series and NoSQL databases, we run an AWS Aurora PostgreSQL RDS cluster for storing and rapidly querying trades, quotes, and trading algorithm results to identify potential market opportunities.
We use RDS Performance Insights for identification of the SQL queries causing performance bottlenecks and the RDS Performance Insights’ metric Database Load for rightsizing of the RDS instances. Thanks to DevOps Guru for RDS we are able to right-size each RDS instance far more aggressively than when doing manually because DevOps Guru for RDS alerts us each time the hardware resources are close to be exhausted – the CPU/Memory/Database Connections anomaly.
The Database Load metric and its use by DevOps Guru for RDS are the key differentiators from other database monitoring tools – the Database Load monitoring built into AWS Aurora with virtually no performance cost normalizes all relevant performance metrics to a single easy-to-interpret metric comparable with the number of vCPUs each database instance has. The other advantages of DevOps Guru for RDS include humanly understandable explanations of all database wait states and provided troubleshooting steps, and integration with SNS / CloudWatch.
The beauty of the RDS Performance Insights and DevOps Guru for RDS is that RDS Performance Insight’s identified SQL statements causing bottlenecks and DevOps Guru for RDS alerts allow instant prioritization of our code areas for further optimization.